The difference between a smooth demo and a profitable workplace: connect perception, control, learning, actuation, safety, and operations to understand bottlenecks and economics.
Select a point to explore the industrial flow, bottlenecks and related companies.
How to read this map
Physical AI connects intelligence that perceives surroundings and selects physical actions to real machines. Not every industrial robot uses learning-based AI, and the term does not only mean humanoids. Read through task definition → perception → computation/control → actuation → site integration → operation → performance measurement. Simulation and data form separate feedback loops across multiple stages. Lines indicate functional dependencies, not contracts or supply chains between companies.
Tasks and economics → Perception and sensors · Tasks and items define observation requirements
Perception and sensors → Computation and control · Plan and control actions from observed states
Computation and control → Actuation and grippers · Execute through commands the drive system can perform
Actuation and grippers → Site integration and safety · Integrate mechanisms with actual equipment and safety systems
Site integration and safety → Operation and recovery · Operation and recovery after on-site validation
Operation and recovery → Performance and reinvestment · Record actual tasks, interventions, and costs
Performance and reinvestment → Tasks and economics · Reassess economics and bottlenecks
Learning and simulation → Perception and sensors · Validate observation conditions and failure types
Learning and simulation → Computation and control · Validate connections among policies, paths, and control
Learning and simulation → Site integration and safety · Support pre-validation without replacing site assessment
Operation and recovery → Learning and simulation · Feed field failures into retraining and retesting
Actuation and grippers → Perception and sensors · Observe action outcomes again
Site integration and safety → Computation and control · Constrain permitted actions, stops, and recovery conditions
Tasks and economics → Learning and simulation · Define tasks, items, and environments to validate
Map limitations
An abbreviated educational map based on official technology and product materials. Company descriptions establish that features exist, not independent performance verification or universal profitability. Economic significance, watch points, and counterarguments are the editor’s conditional analysis. Actual adoption, profits, or safety certification of any model are not guaranteed. OSHA material is a US industrial-robot safety reference, not legal guidance directly applicable to Korean rules or every mobile robot or humanoid. Current site-specific rules and risk assessments must be checked separately. This is not an earnings or share-price forecast or investment recommendation.
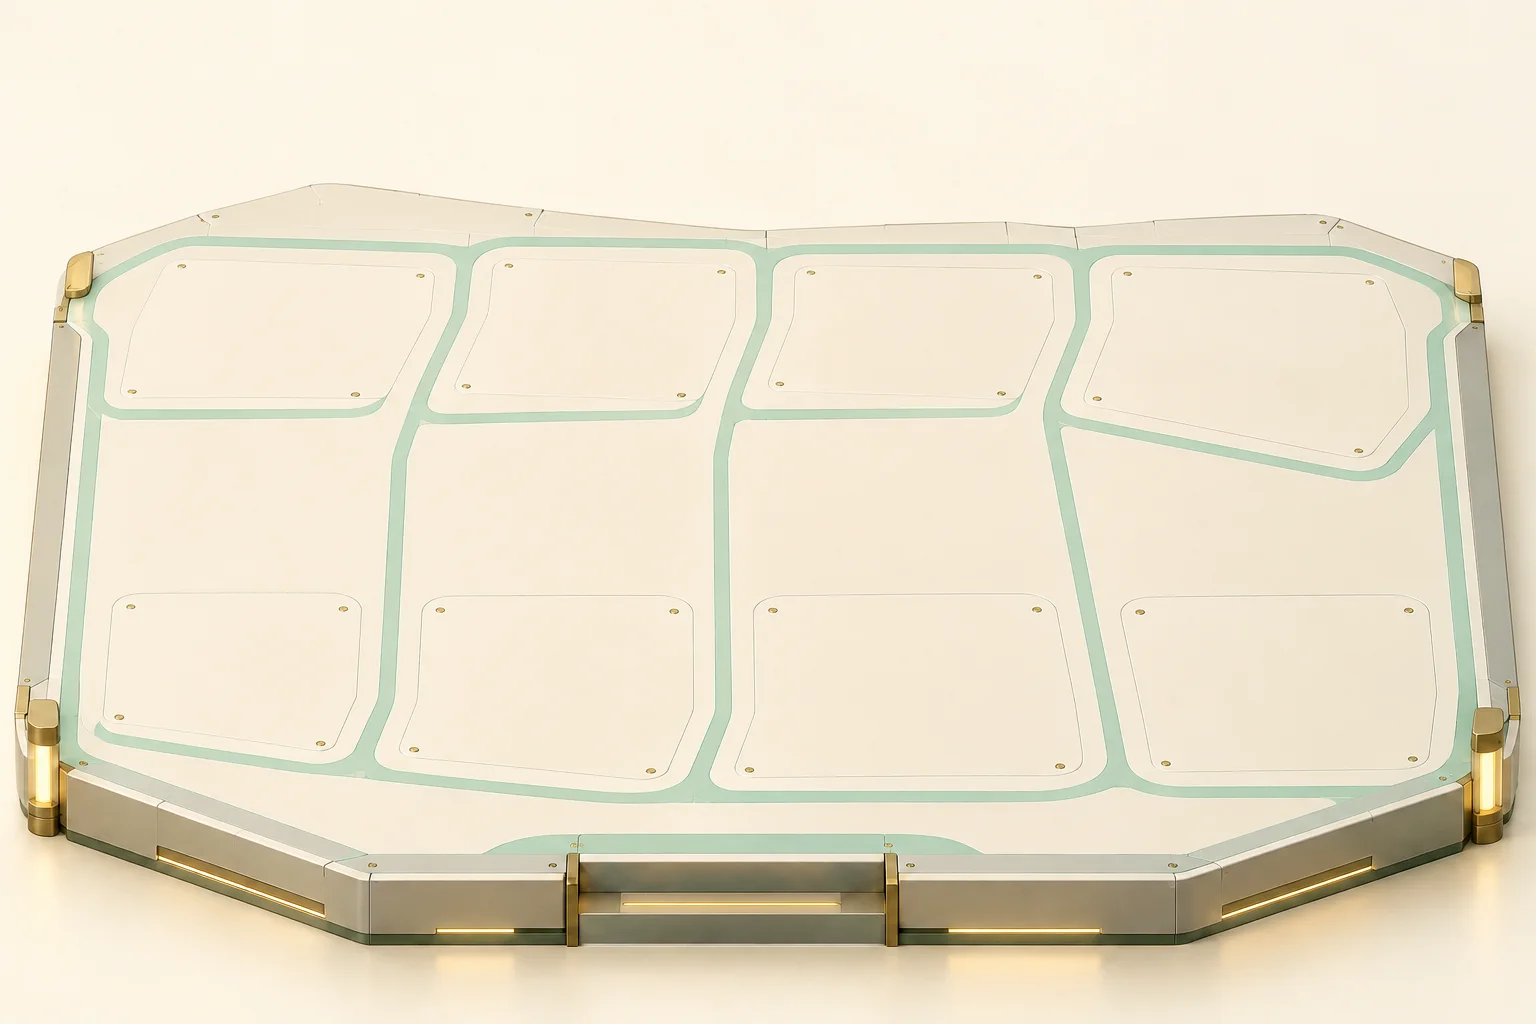
Educational industry diagram, not a reproduction of actual layouts, geography or operating routes.
Site operation
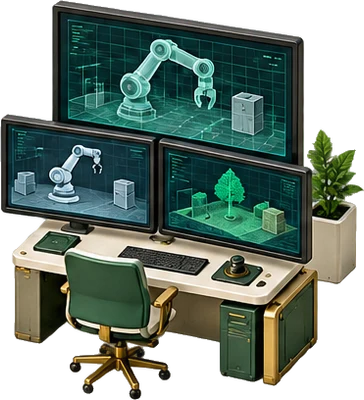
Operation and recovery
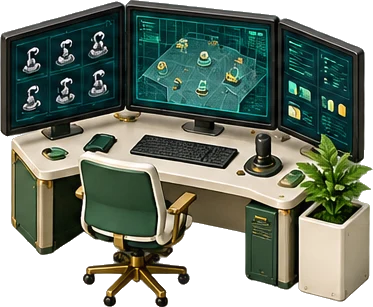
Manage task allocation, charging, maintenance, and human intervention together.
Why it matters
Analytical perspective: examine intervention duration and required skill, not just frequency. If dozens request recovery at once, operating staff can become a bottleneck despite high average success rates.
Related companies
OMRON Robotics
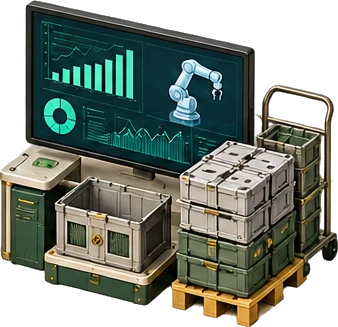
FLOW Core for mobile-robot task allocation, traffic, charging, and operating analytics
SICK
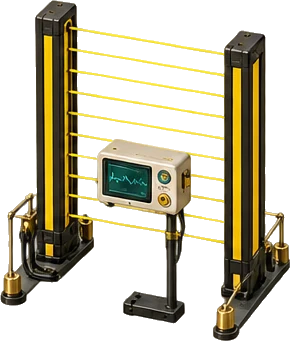
Protective systems and safety sensors for robot applications approached by people
Explanation
OMRON FLOW Core provides mobile-robot task allocation, traffic and charging management, and operating analytics. OSHA material explains the need to check operating conditions and safety performance and retain inspection records even after acceptance testing. One robot’s success differs from managing several. Site performance requires recording waits and charging at narrow aisles and handover points, plus human recovery time.
Industry perspective
Indicators to watch
Are interventions per 100 tasks and time per intervention recorded separately?
Did traffic, charging, or handover waits increase as robot numbers grew?
Are failure causes and change histories retained, with recovery staff assigned?