
Dialogue
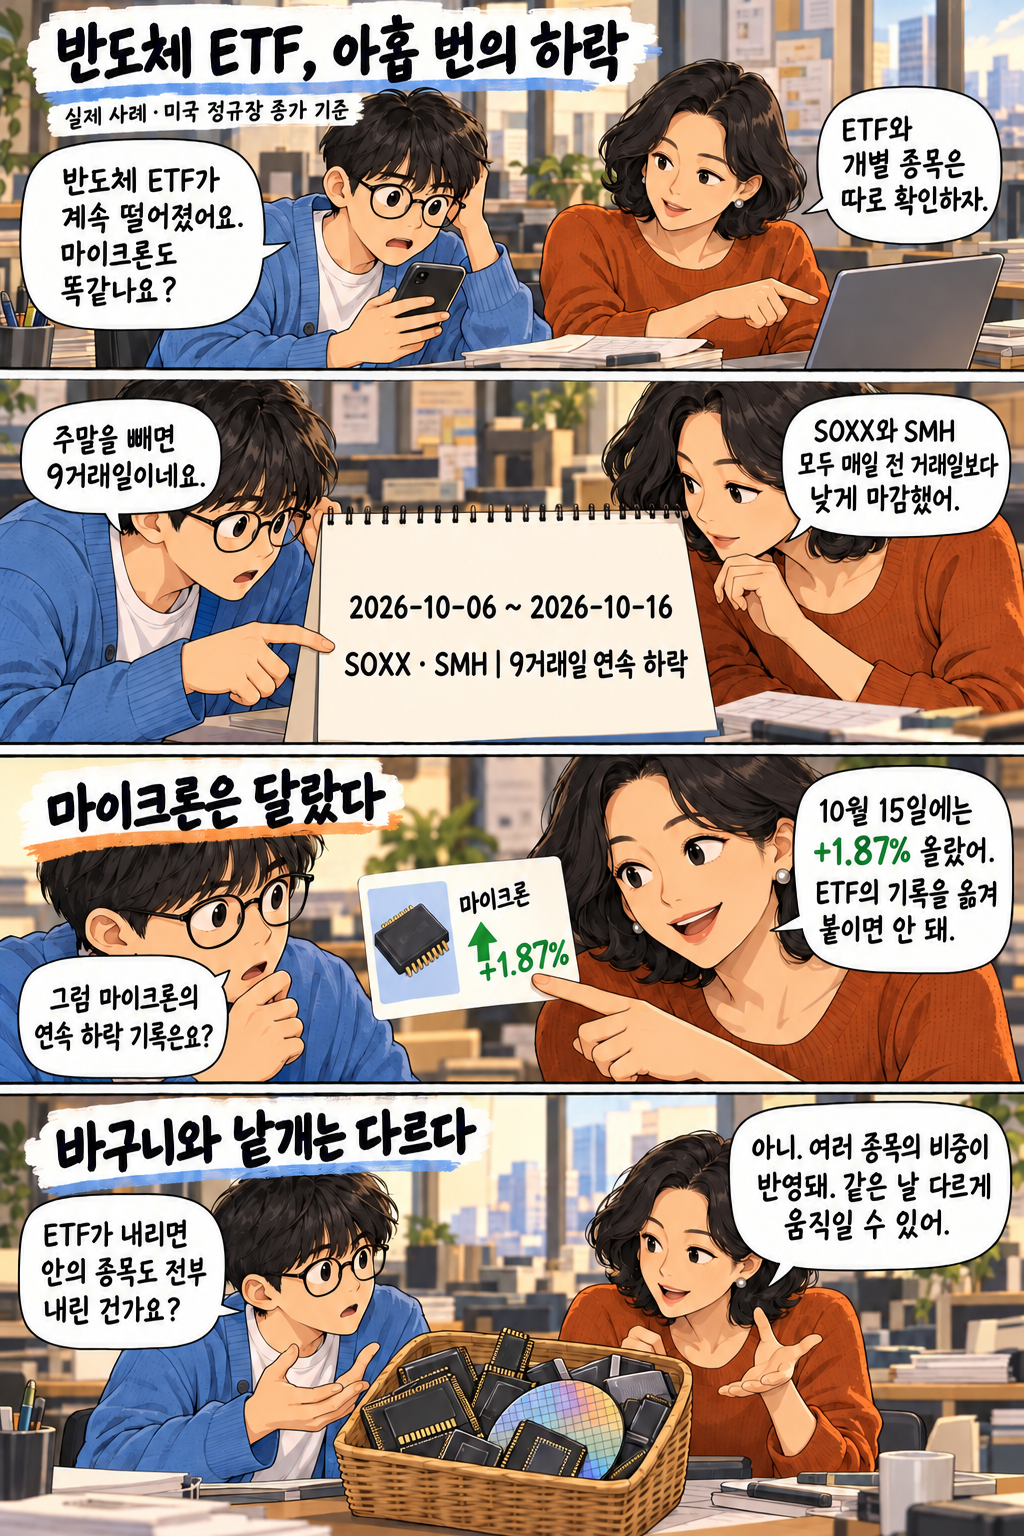
Semiconductor ETFs: Nine Consecutive Declines Actual case · US regular-session closing prices Jun: Semiconductor ETFs keep falling. Is Micron the same? Yeon: Let's check ETFs and individual stocks separately. 2026-10-06 ~ 2026-10-16 Jun: Excluding weekends, that is 9 trading sessions. Yeon: SOXX and SMH both closed below their previous close every day. SOXX · SMH | 9 consecutive declining trading sessions Micron was different Jun: What about Micron's losing streak? Yeon: It rose +1.87% on 10/15. We must not transfer the ETF's record to it. A basket is different from its individual items Jun: If an ETF falls, did all its holdings fall too? Yeon: No. Several stocks and their weights contribute. They can move differently on the same day.

Dialogue
The evidence behind '20 years' Jun: I also heard this was the first time since 2006. Yeon: Benzinga reported that SOXX had its longest losing streak since May (month 5), 2006. Confirming a report versus verifying the entire series Jun: Did you recalculate the entire historical price series too? Yeon: No. We directly cross-checked these 9 sessions; the historical comparison is attributed to the report. Nine declines mean a bottom? Jun: Can we assume a rise comes next? Yeon: The number of consecutive declines alone cannot determine the next return. Who recovers the cost of AI investment? Jun: If AI demand is strong, shouldn't shares rise too? Yeon: Demand and share prices are different. Whether investment can be recovered through actual revenue and cash also matters.

Dialogue
Memory demand and share prices are separate Jun: Does the same conclusion apply to Samsung Electronics and SK hynix? Yeon: Both companies have discussed AI memory demand. But a company's outlook does not guarantee higher share prices. Variables to examine at each company Jun: What should we compare? Yeon: Look at HBM shipments, prices, yields and expansion costs. For Samsung Electronics, examine other businesses' results too. Evidence that changes a judgment Jun: If orders and cash flow remain robust, we could reassess the concerns. Yeon: Conversely, confirmed investment cancellations or weaker profitability would call for more caution. Let's not decide the outcome yet. The question that matters more than the count Jun: What deteriorated, by how much, and what has the price reflected? Yeon: Exactly. Separate the ETF's record, individual companies' earnings and your own investment judgment. 2026-10-16 US market close · Not investment advice The characters and dialogue are editorial creations, not statements by actual representatives.